You’ve learned the fundamentals of Power BI; what’s next? It’s time to apply your skills by working on case studies that you can add to your data analyst / BI analyst portfolio. Companies are always looking for individuals with experience managing a piece of analysis using business intelligence tools from start to finish. This can involve preparing data, visualizing it, and using your new insights to tell a story.
We have many case studies available for you to take on DataCamp; you can find our Power BI courses and case studies on a separate page.
Power BI Projects for Beginners
In this section, we’ve included various case studies to start you on your journey of managing an end-to-end dashboard development and analysis process. These beginner projects will enable you to put your fundamental Power BI skills into practice.
Analyzing Customer Churn
In the Analyzing Customer Churn in Power BI case study, you will use your analytics hat to uncover insights on customer churn for a fictional telecoms company called Databel. Reducing customer churn is their top priority, so you’ll start by first understanding what churn is and how much churn the organization is seeing. But you’ll take it a step further by figuring out why customers are churning and providing recommendations on reducing churn.
In this project, you will:
- Create calculated columns and measures with DAX
- Filter and slice your data for deeper analysis
- Combine visualizations to create eye-catching report pages
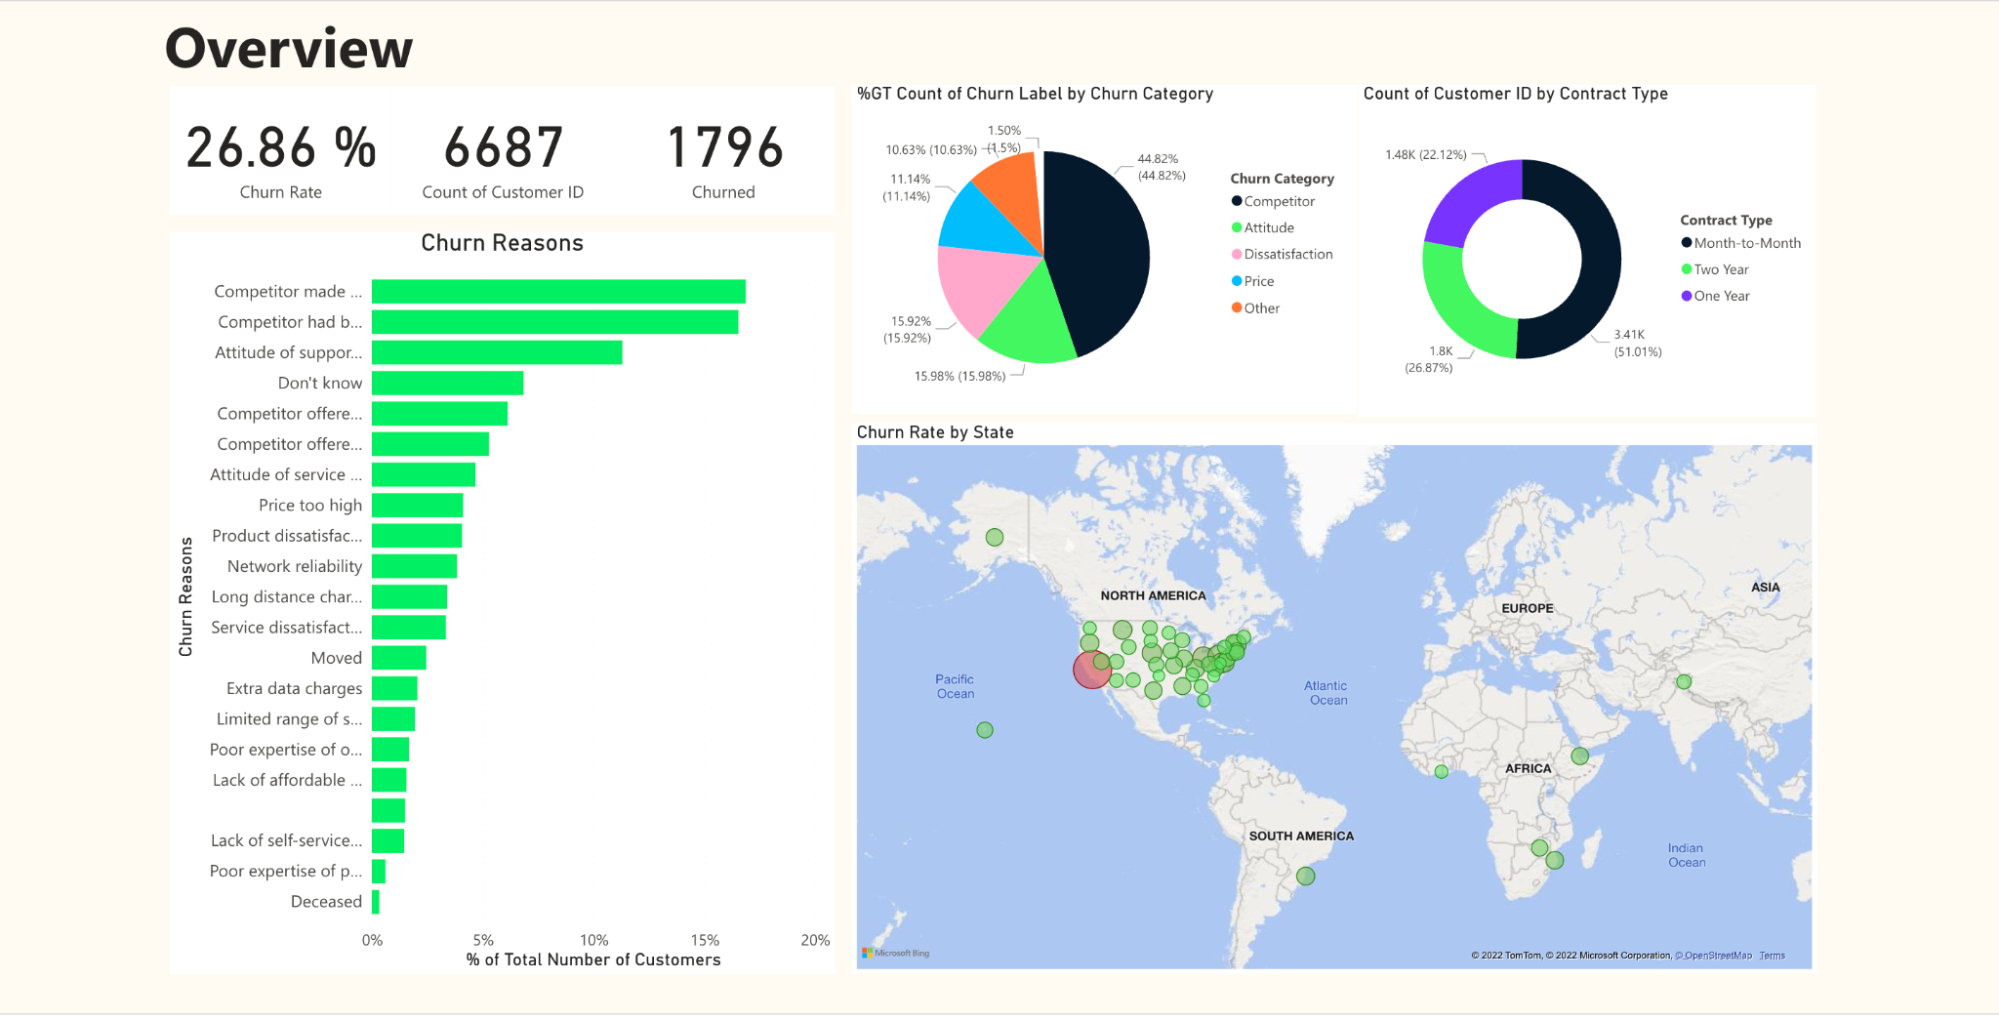
Above is an example of an overview page you might create while taking this case study. Don’t be afraid to inject your creativity when building your own dashboards! Check out our full Power BI dashboard tutorial for some inspiration.
Analyzing Job Marketing Data
In the Analyzing Job Market Data in Power BI case study, you will explore a real-world job posting dataset to uncover insights for a fictitious recruitment company, DataSearch. You’ll start by preparing the data and carrying out an initial exploratory analysis of the data before diving deeper into the most in-demand skills for data scientists, analysts, and engineers.
In this project, you will:
- Use Power Query to investigate and clean data
- Write DAX formulas
- Build business-ready reports
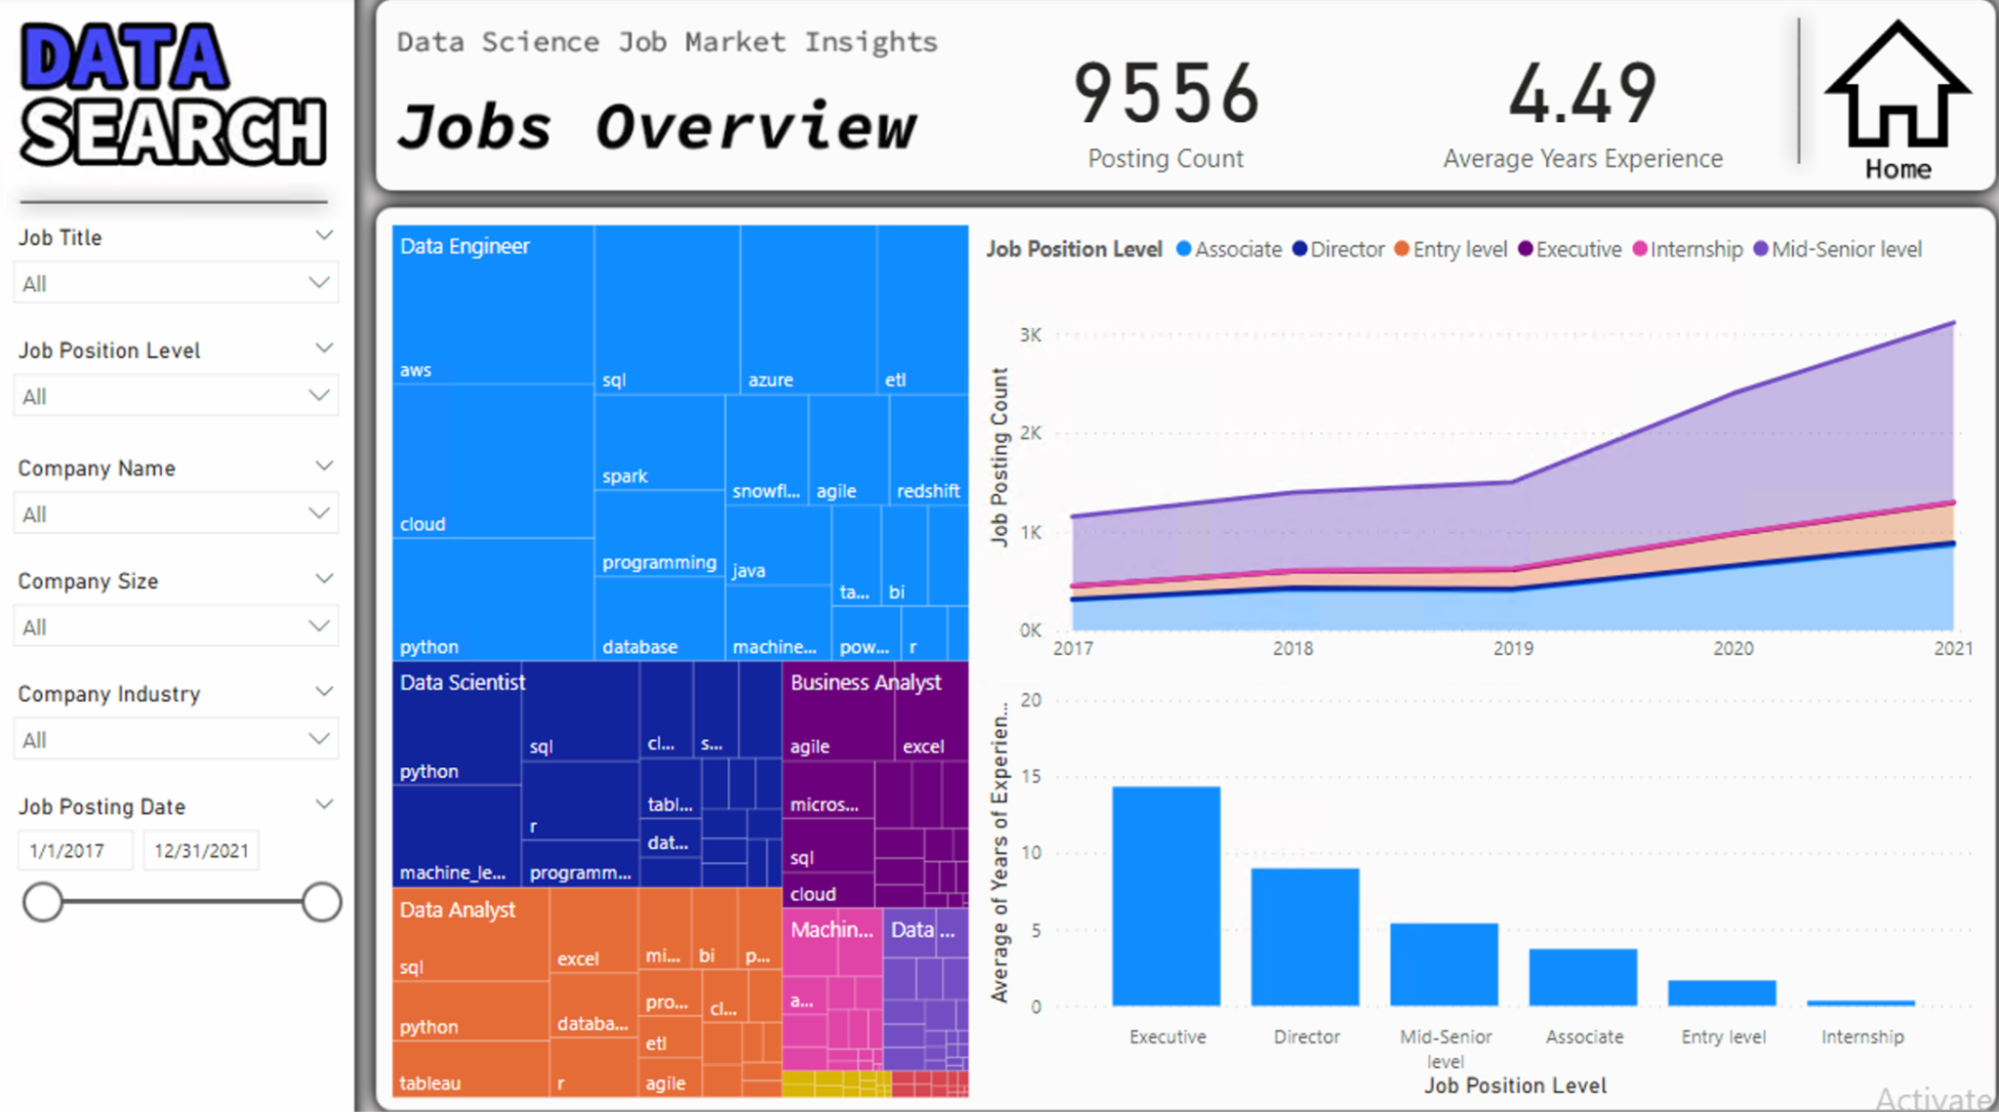
Here is an example of a page you might create whilst taking this case study.
HR Analytics
In the HR Analytics in Power BI case study, you’ll explore HR data for a fictitious software company called Atlas Labs. The primary goal is to summarize information on key employee metrics and dive deeper into areas such as employee performance and attrition. This process will involve understanding factors contributing to attrition and identifying appropriate actions to enhance employee retention.
In this project, you will:
- Prepare your data ready for analysis and create a data model
- Create calculated columns and measures with DAX
- Build a 4-page Power BI report ready for analysis
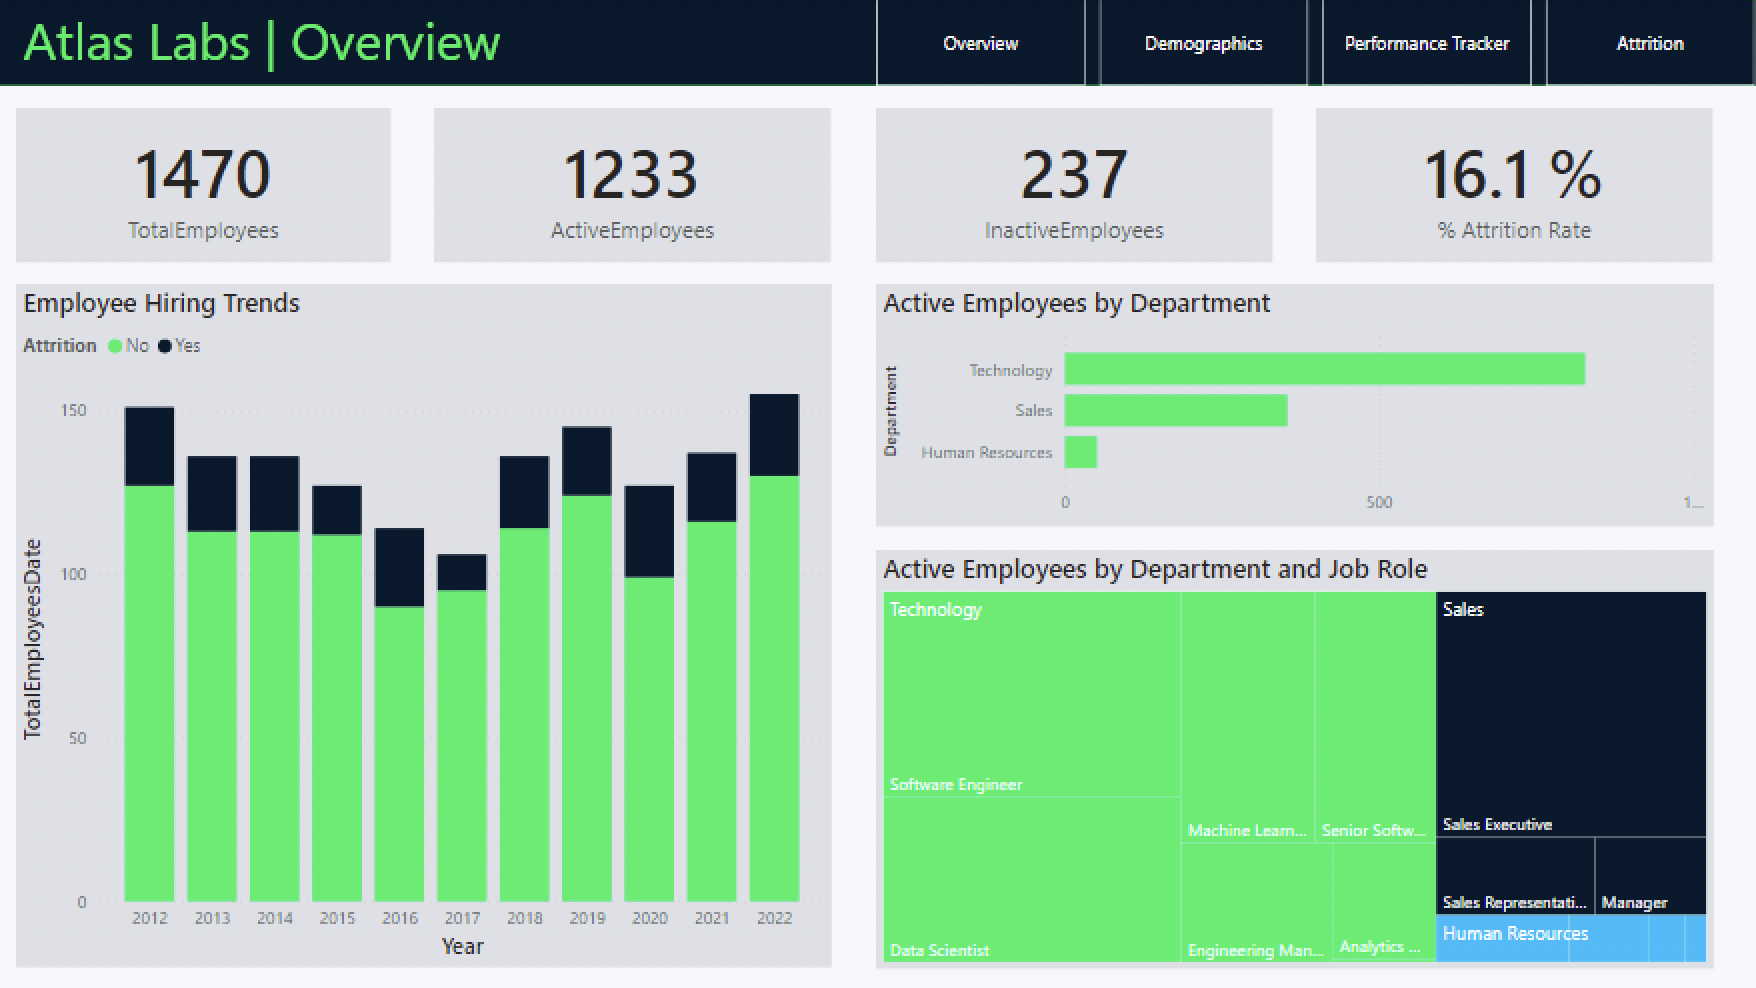
Here is an example of a page you might create while taking this case study.
Power BI Case Studies for Intermediate Learners
In this section, we’ve included various case studies to start you on your journey of managing an end-to-end dashboard development and analysis process. These intermediate projects will further push the realms of detailed industry knowledge and Power BI skills.
Inventory Analysis
In this Inventory Analysis in Power BI case study, you’ll put your skills to the test with a real-world challenge based on a fictional retailer WarmeHands Inc. The primary goal of this case study is to identify potential improvements in inventory management and purchasing strategies. You’ll investigate inventory turnover and ABC analysis, then identify which products should be prioritized.
In this project, you will:
- Prepare your data ready for analysis using Power Query
- Write intermediate DAX functions for data manipulation
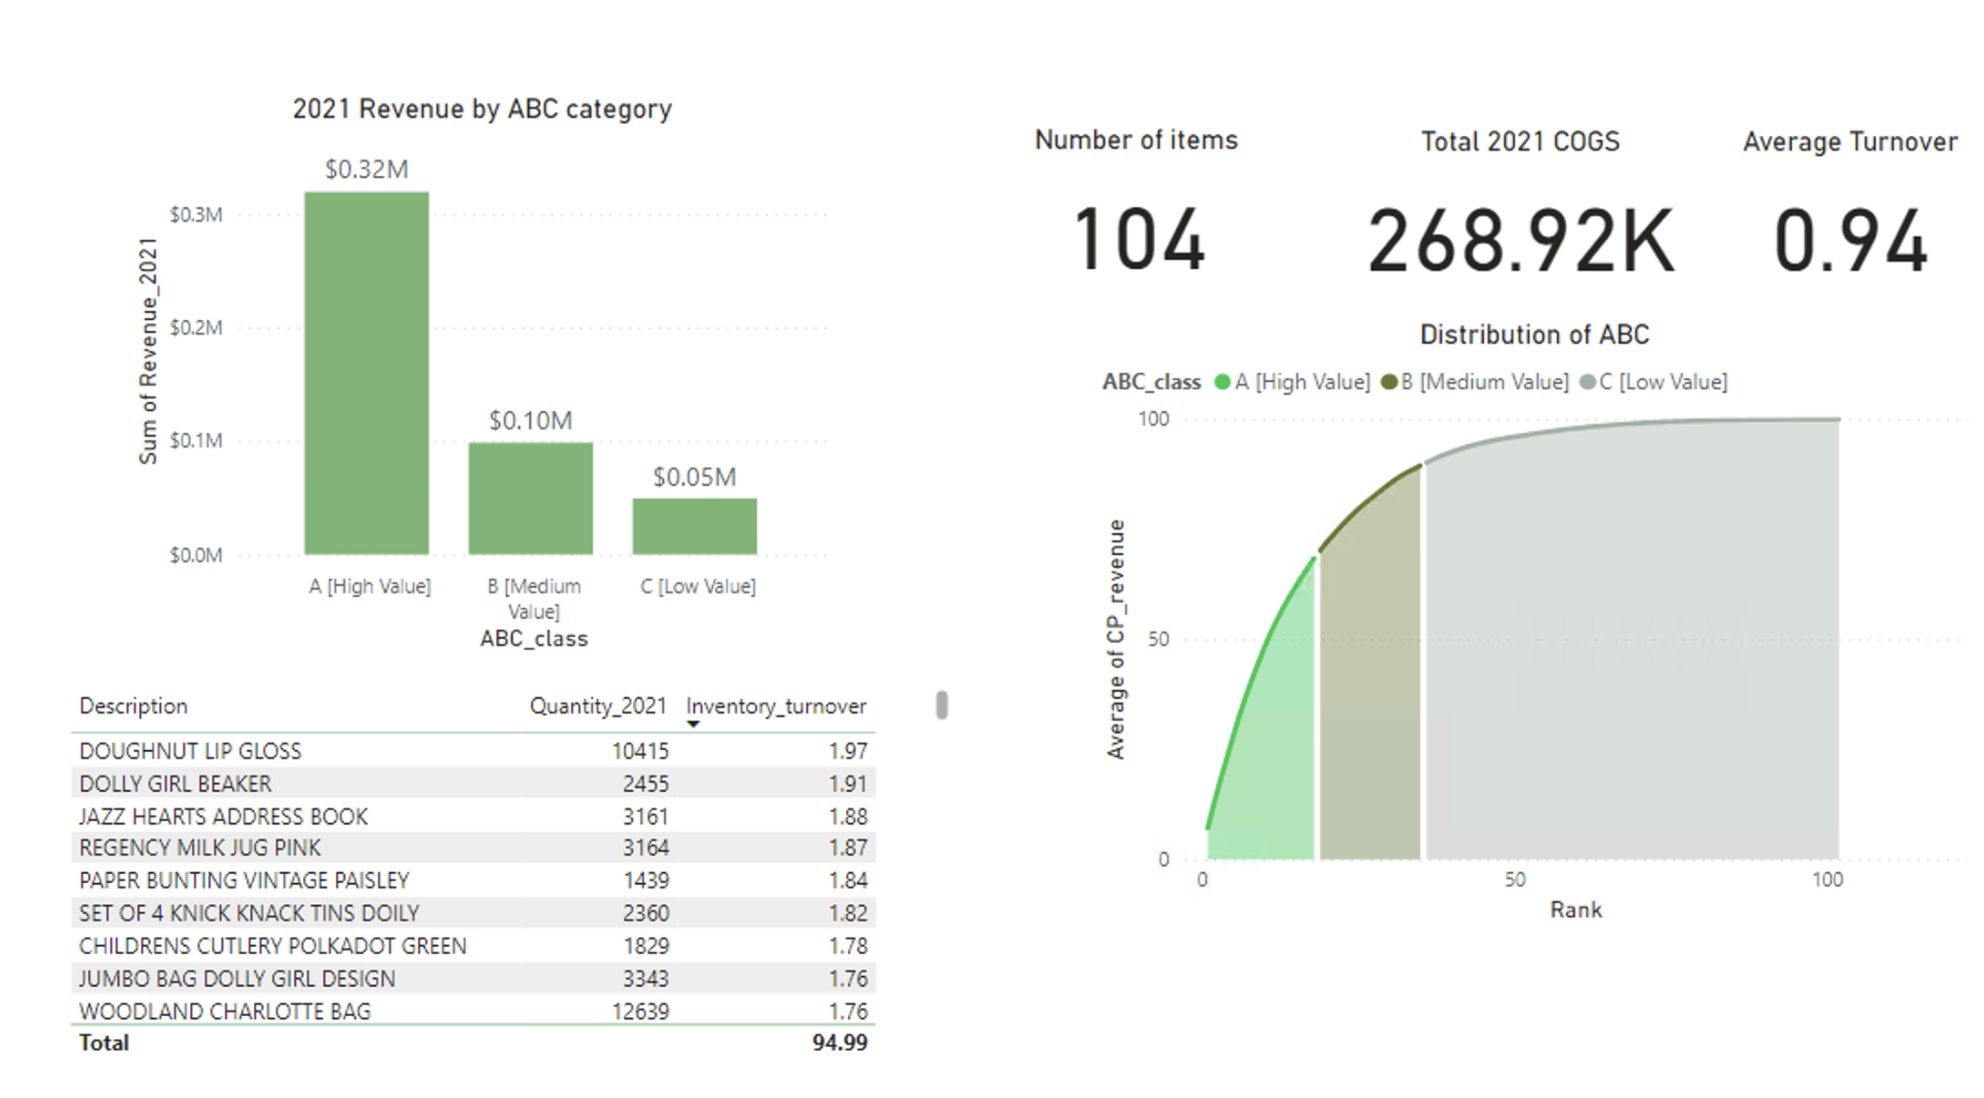
Here is an example of a page you might create whilst taking this case study.
Supply Chain Analytics
In this Supply Chain Analytics in Power BI case study, you’ll be acting as a Supply Chain Analyst for a fictitious company called Tenate Industries that focuses on replacement parts for industrial pizza ovens. The primary goal of this case study is to develop a make versus buy analysis tool in Power BI. You’ll develop a quote analysis tool and cost scenario analysis based on production volumes and integrate cost data for a more detailed analysis.
In this project, you will:
- Write intermediate DAX functions for data analysis
- Create dynamic scenario analysis using slicers
- Apply row-level security
- Build a Make vs Buy report page
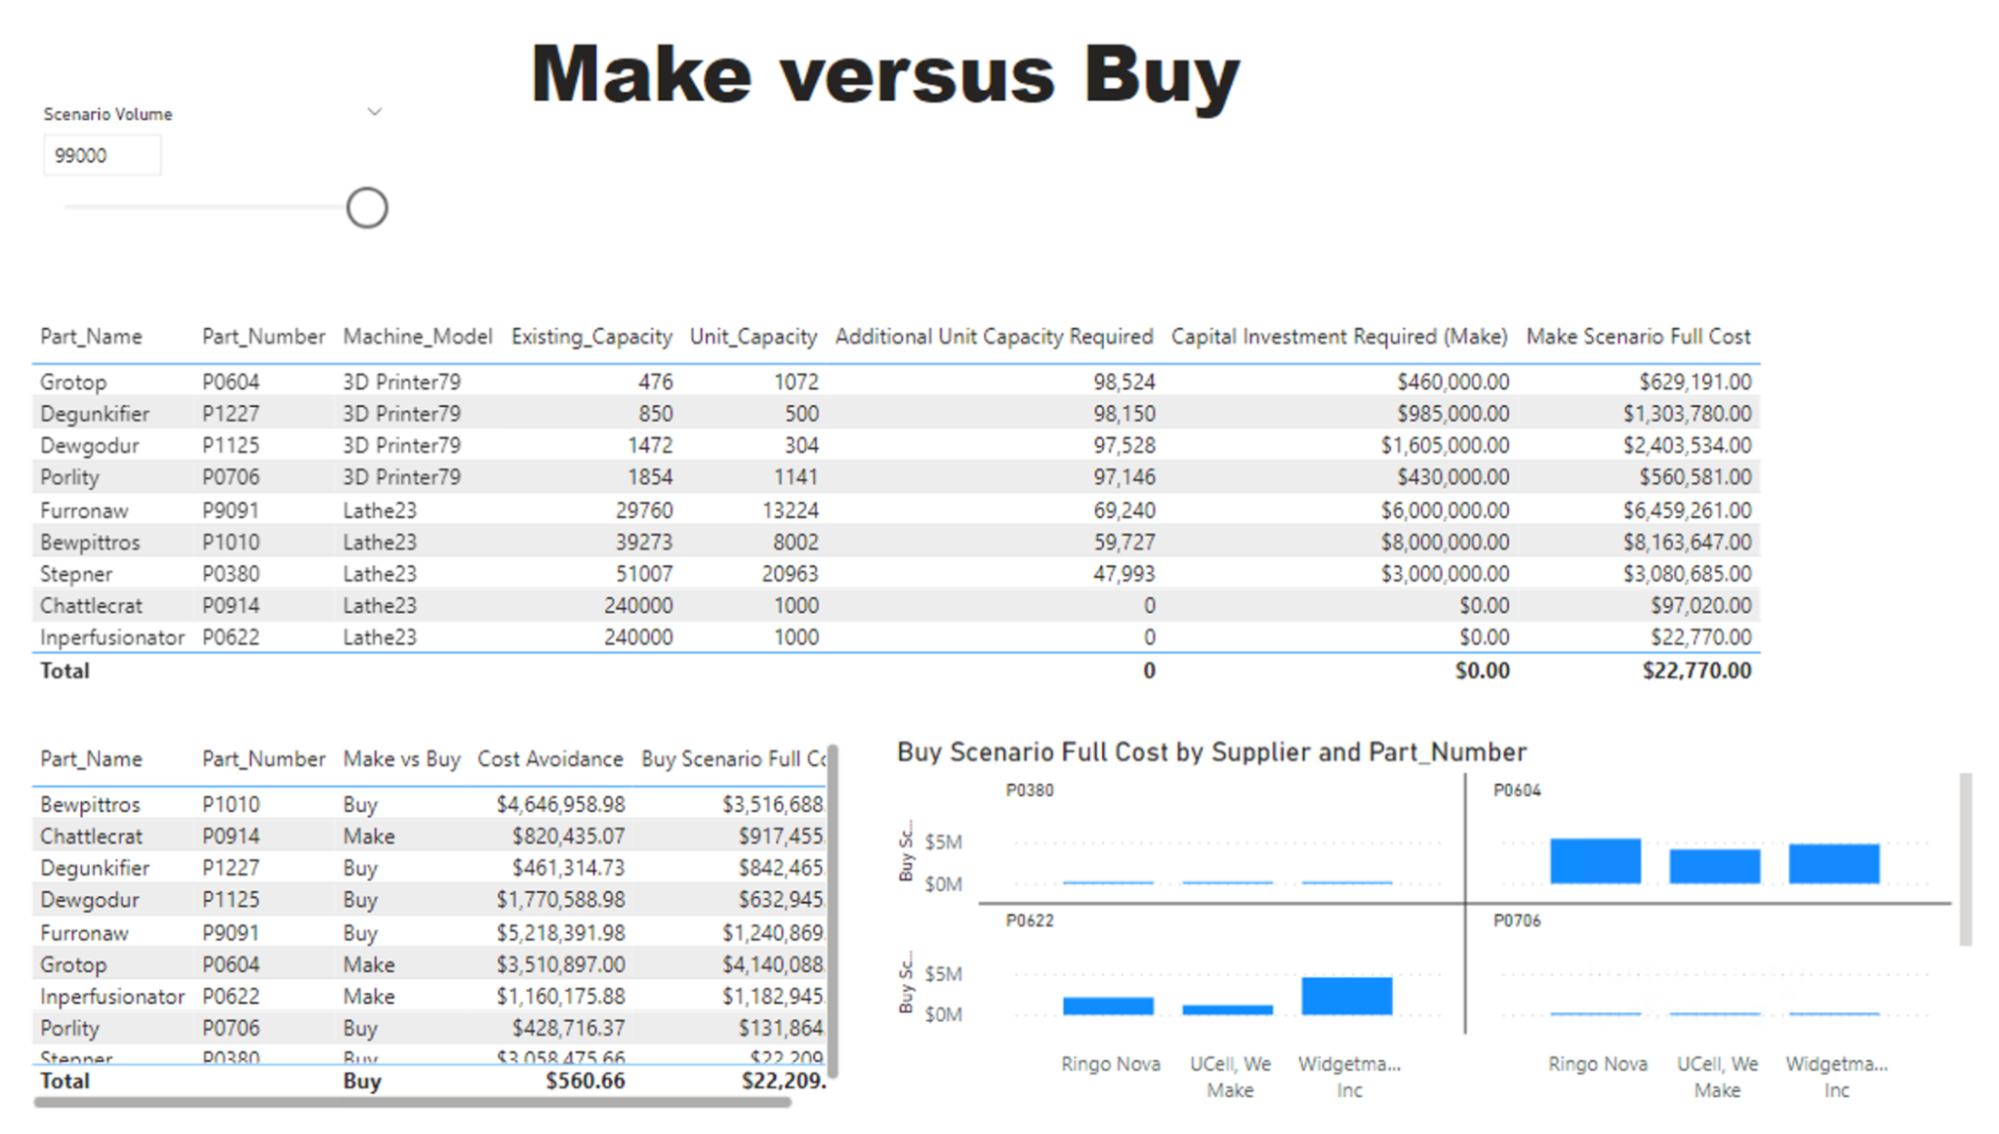
Above is an example of a page you might create on this Power BI project.
Analyzing Healthcare Data
In this Analyzing Healthcare Data in Power BI case study, you’ll be acting as a consultant for a fictional consulting company called HealthStat but exploring a real-world dataset. The primary goal of this case study is to uncover hospital efficiency insights and make recommendations for change. You’ll conduct an initial exploratory analysis before diving deeper into hospital performance outliers and understanding the factors most influence length of stay and cost per patient discharge.
In this project, you will:
- Load data and create a data model
- Write DAX functions for data analysis
- Utilize advanced visualizations such as Key Influencers
- Develop a 3-page branded report to share with stakeholders
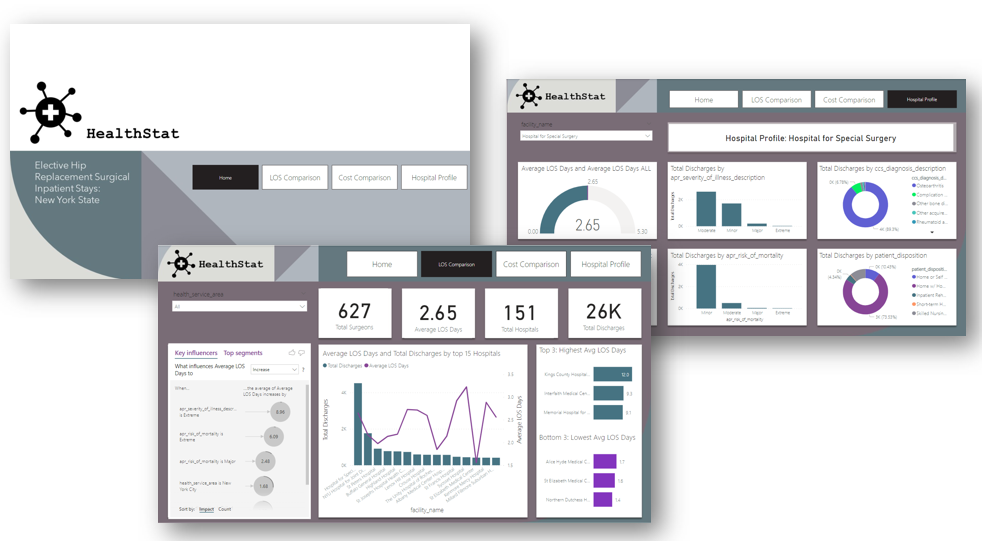
On this Power BI project, you might create a final deliverable like the one shown above.
Competitor Sales Analysis
In this Competitor Sales Analysis in Power BI case study, you’ll work on real-world business use cases for a fictional manufacturing company called Sintec. The primary goal of this case study is to help Sintic assess company product performance compared to competitors. You’ll focus on sales and market share analysis for internal performance, focusing on product revenue.
In this case study, you will:
- Utilize PowerQuery to clean and transform the data
- Write DAX functions to compare performance
- Utilize AI visualizations
- Develop a branded report to share with stakeholders
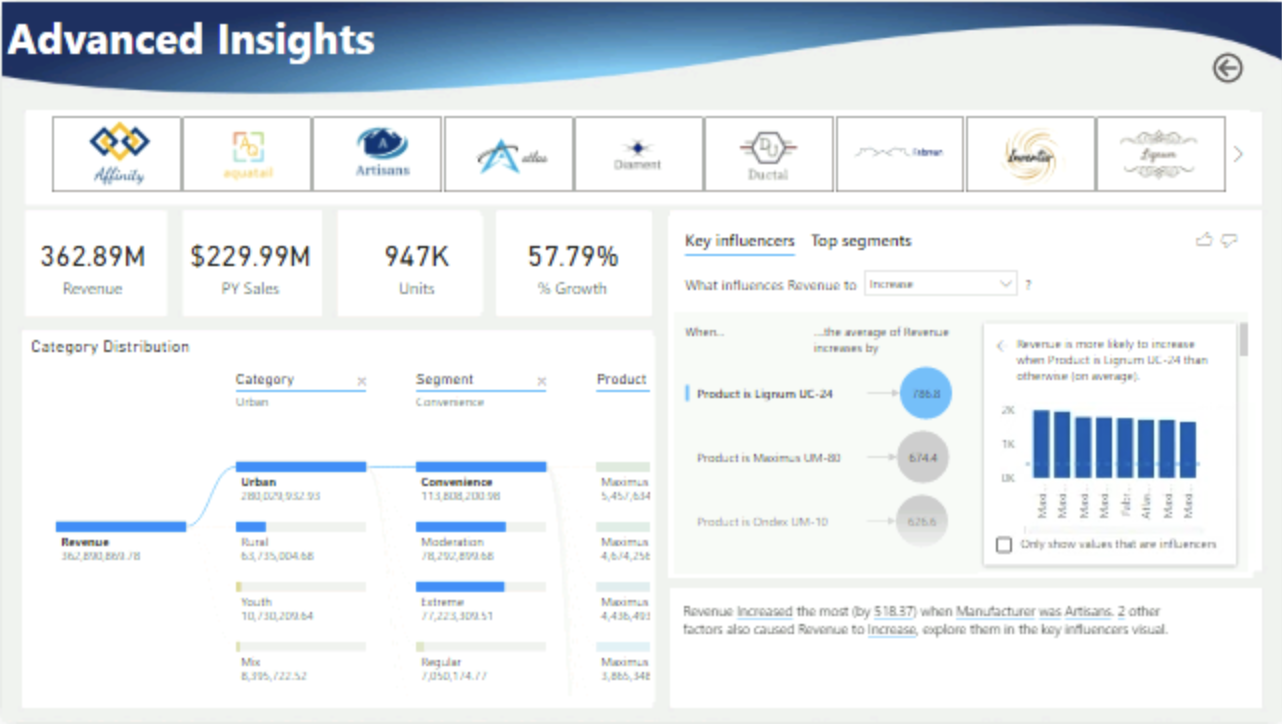
Here is an example of a page you might create whilst taking this case study.
Mortgage Trading Analysis
In this Mortgage Trading Analysis in Power BI case study, you’ll be acting as a newly hired junior trader on a trading desk at a Mortgage Originator. This fast-paced and challenging case study will enable you to learn the ins and outs of the financial system. The primary goal of this case study will be to identify a population of mortgages to trade and evaluate each mortgage and bid received from prospective buyers before finally deciding to execute a trade.
In this case study, you will:
- Write advanced DAX calculations to analyze mortgage data
- Utilize advanced visualizations such as Key Influencers
- Carry out detailed analysis with multiple visualizations
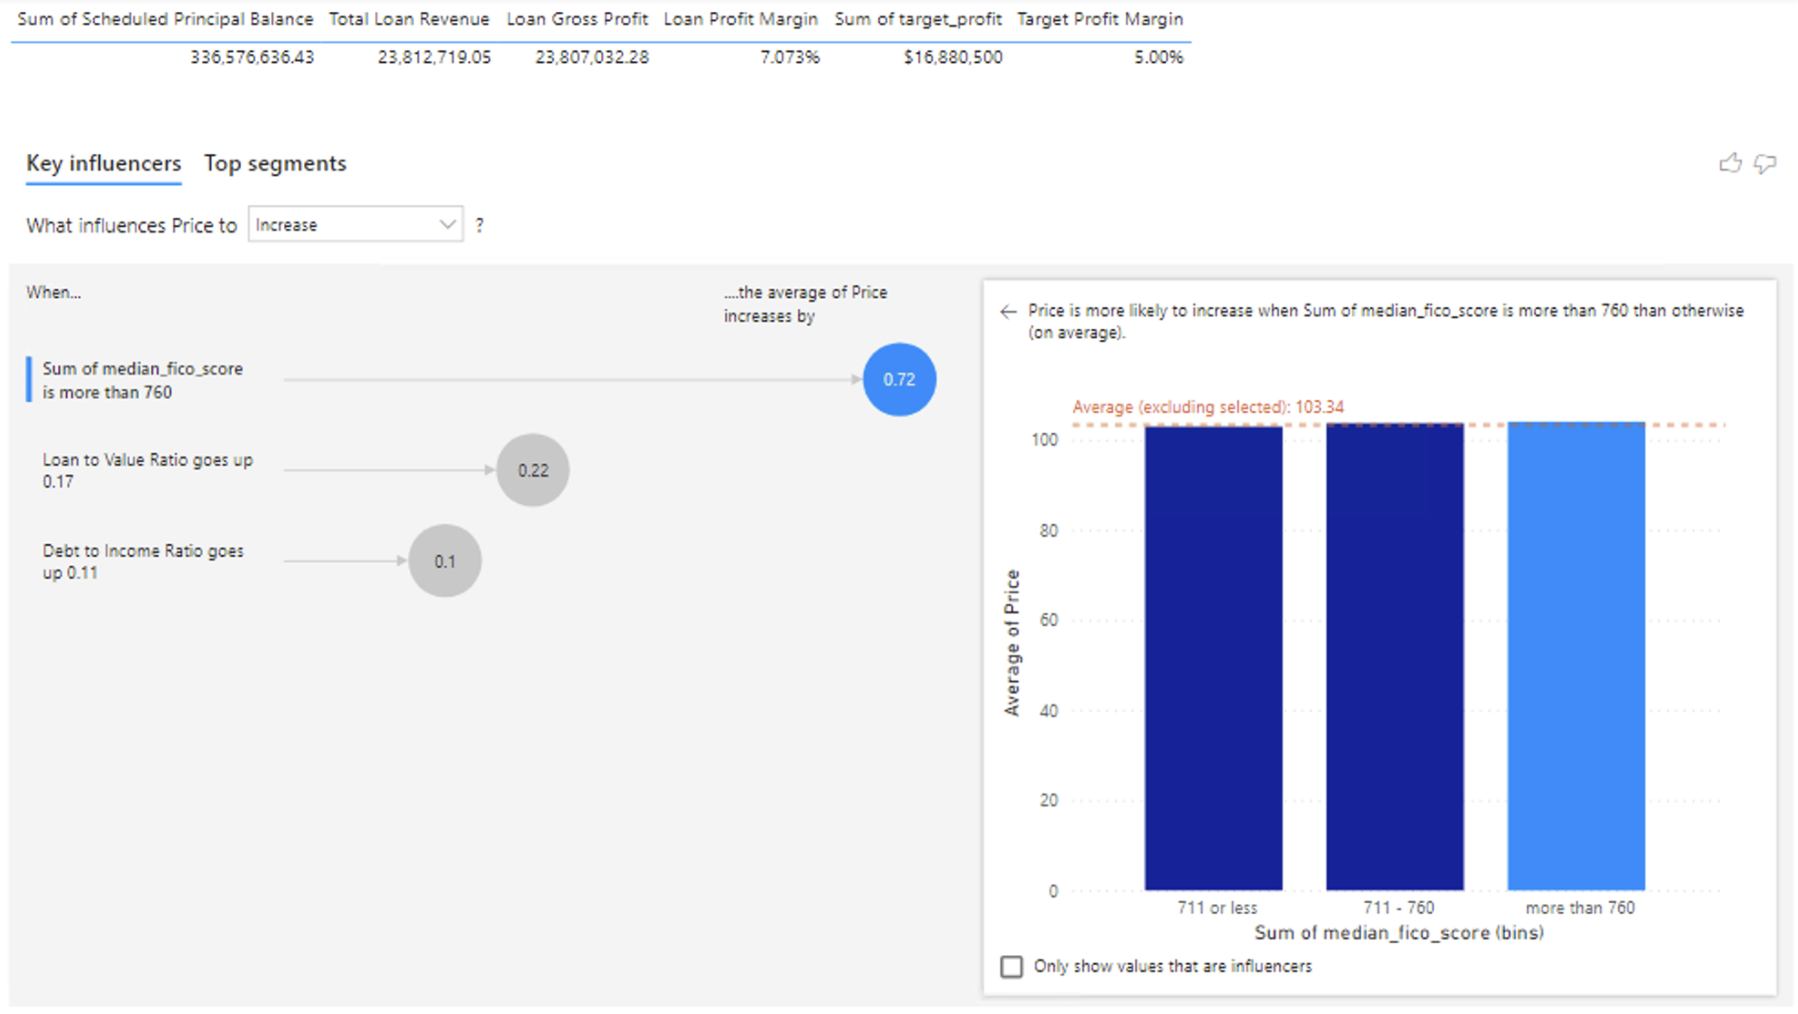
Here is an example of a page you might create whilst taking this intermediate Power BI project.
Conclusion
After learning the essentials, these case studies give you the foundation to build a strong portfolio to help showcase your skills.
In this post, we have learned about beginner and intermediate projects covering data modeling, data transformation to visualization, and storytelling.
So, what’s next? Now that you’ve followed a guided approach to projects - try experimenting with more complex datasets and see what insights you can derive! If you’d like to test your Power BI skills further, keep an eye out for Power BI-related competitions. To gain some inspiration, you can also check out our article, Top 9 Power BI Dashboard Examples.

Top 10 Business Intelligence Conferences in 2024

Elena Kosourova
5 min


Becoming Remarkable with Guy Kawasaki, Author and Chief Evangelist at Canva

Richie Cotton
55 min
Mastering SWITCH in DAX for Power BI: A Comprehensive Guide

Joleen Bothma
10 min
A Step-By-Step Guide to Visualizing KPIs in Power BI
Joleen Bothma
8 min
Power BI Slicer Tutorial: A Comprehensive Guide to Enhancing Your Reports
Joleen Bothma
7 min
Complete Guide to Power BI Conditional Formatting
Joleen Bothma
7 min