Course
Introduction to Power BI
3 hr
330.3K
The SWITCH function in Power BI is a logical DAX function that provides a more structured and readable way to handle multiple conditions than nested IF statements.
In this tutorial, we will examine the SWITCH function in detail. We will discuss what it is, how to use it, and some common pitfalls and best practices for using the function.
To get started with Power BI and DAX, check out our Power BI fundamentals skill track and keep our DAX cheat sheet on hand for a quick reference on many of the most useful DAX functions you will encounter.
The SWITCH function in DAX for Power BI makes it easier to write conditional statements. It evaluates an expression and then compares it to a series of values, returning the first matching result.
SWITCH can replace multiple nested IF statements by condensing multiple conditions into a single function. This leads to cleaner, simpler DAX expressions that are easier to read and maintain. It also improves the readability of your formulas, making it easier for you and others to understand and modify your calculations.
The basic syntax for the SWITCH function is:
SWITCH(<expression>, <value>, <result>[, <value>, <result>]…[, <else>])Here is a quick tip for reading basic syntax statements (like the one above) that you will commonly find in tutorials and in the official Microsoft Power BI documentation. The statement above shows two <value> and <result> parameter sets, with the second set enclosed in square brackets. This means there can be more than one set of values and results which are optional to the SWITCH function. Similarly, the <else> part of the function is also wrapped in square brackets, so it's also optional.
The traditional way to handle multiple conditions in DAX would involve nested IF statements, which can quickly become complex and difficult to read. For example, handling four conditions would require three nested IF functions. In contrast, the SWITCH function streamlines this by allowing a straightforward list of condition-result pairs, improving both readability and maintainability.
Although multiple nested IF statements can achieve the same result as SWITCH, SWITCH is still preferred because they are easier to write and less prone to error. Many IF calls can also negatively impact a report's performance. However, it’s good to remember that the SWITCH function can also impact report performance. This is why we will discuss strategies for optimizing your SWITCH functions along with some best practices later in this tutorial.
SWITCH is particularly suited for scenarios where you have a defined set of possible values for an expression and a corresponding result for each.
It's cleaner and more efficient than using multiple nested IFs, especially as the number of conditions grows. This makes SWITCH an excellent choice for complex calculations where readability and performance are concerns.
However, while SWITCH can enhance readability, its performance benefits over nested IF statements largely depend on the specific use case and the underlying data model.
These examples illustrate the versatility of the SWITCH function in addressing various business scenarios in Power BI. By replacing complex nested IF statements with SWITCH, you can achieve clearer, more maintainable DAX formulas.
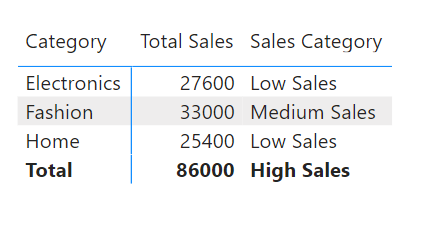
Imagine a business wanting to categorize its sales into different levels based on the total sales amount to analyze its sales performance more effectively.
In the DAX formula below, we use the SWITCH function to assign a sales category based on the total sales amount. You’ll notice that we use the logical function TRUE() as the expression in our formula. This is because SWITCH only looks for exact matches, and we want to use operators like greater than and less than in our formula. So, by setting the expression to TRUE(), SWITCH will evaluate each condition until a match is found (i.e., when the result is true).
Sales Category =
SWITCH(
    TRUE(),
    [Total Sales] < 10000, "Low Sales",
    [Total Sales] < 50000, "Medium Sales",
    [Total Sales] >= 50000, "High Sales",
    "Unknown")
Here’s the result in Power BI:
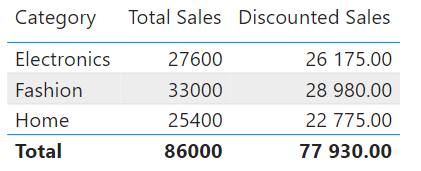
Suppose a retail chain applies different discount percentages to products based on their net sales price to maximize profitability. They want to calculate the total value of discounted sales in their store.
In the DAX formula below, we use the SWITCH function inside of a variable. Since we will not need to use the formula for discount percentage anywhere else in our report, we can reduce repeated calculations and only evaluate it within this formula for discounted sales.
DiscountedSales =
    VAR DiscountPct = SWITCH(
        TRUE,
        Sales[Net Price] <= 150, 0.15,
        Sales[Net Price] <= 500, 0.2,
        Sales[Net Price] <= 1000, 0.3,
        0
    )
    VAR DiscountAmount = Sales[SalesAmount] * (1 - DiscountPct)
    RETURN
    DiscountAmount
Here’s the result in Power BI:
This section reviews some common pitfalls when using the SWITCH function with recommendations for avoiding them.
Using SWITCH for scenarios where a simple IF statement would suffice can unnecessarily complicate your DAX formulas.
Instead, reserve SWITCH for cases with multiple conditions. For one or two conditions, consider using IF for simplicity.
Extensive use of the SWITCH function, especially with complex expressions, can slow down report performance in large datasets.
Optimize expressions within SWITCH by pre-calculating complex parts using variables. Variables make the SWITCH expression cleaner and easier to understand, indirectly contributing to optimization by reducing the chance of redundant or unnecessary calculations.
Calculate common expressions or complex parts of your conditions once and store them in variables. This avoids recalculating the same expression multiple times within the SWITCH function.
Misusing the default case in SWITCH to handle errors or unexpected values without proper consideration can lead to incorrect results.
Clearly define conditions and explicitly handle known scenarios. Use functions like IFERROR or ISBLANK to manage unexpected or missing values.
Forgetting that SWITCH evaluates in the current context can lead to unexpected results, especially when used within row or filter contexts. Check out our introduction to DAX course, where we discuss contexts in more detail.
When designing your SWITCH expressions, always consider the current row or filter context. Use context transition functions like CALCULATE judiciously to adjust the context as needed.
Overlooking the order of conditions in the SWITCH statement can lead to unexpected results, as the SWITCH function evaluates the conditions in the order they are defined and uses the first matching condition.
Ensure that each case appears in the correct sequence, just like you would do with nested IF statements.
Here are some best practices for using SWITCH effectively:
If you're looking for a more efficient and versatile way to handle multiple conditions in Power BI, SWITCH is the answer. Unlike nested IF statements, the SWITCH function condenses multiple conditions into a single function, leading to cleaner and simpler DAX expressions that are easier to read and maintain. Plus, it improves the readability of your formulas, making it easier for you and others to understand and modify your calculations.
However, avoid making some common mistakes when using the SWITCH function and follow the best practices we discussed in this tutorial.
If you’re serious about starting a career as a Power BI developer, check out our step-by-step guide to becoming a BI developer along with the complete Data Analyst in Power BI career track, which will teach you everything you need to know to start using Power BI in practice.
Start Your Power BI Journey Today!
Course
Course
Course
Zoumana Keita
15 min
Elena Kosourova
5 min
Richie Cotton
55 min
Joleen Bothma
8 min
Joleen Bothma
7 min
Joleen Bothma
7 min