
Track
Machine Learning Engineer
44hrs hr
As data scientists, we usually don’t get involved with deployment and maintenance—we build the statistical models, and engineers do the rest.
However, things are starting to change!
With the increasing demand for data scientists who can bridge the gap between model creation and production, familiarizing yourself with automation and CI/CD (Continuous Integration/Continuous Deployment) tools can be a strategic advantage.
In this tutorial, we’ll learn about two popular automation tools: Make (local automation) and GitHub Actions (cloud-based automation). Our main focus will be on incorporating these tools into our data projects.

GitHub Action and Make. Image by Abid Ali Awan.
If you want to learn more about automation in the context of data science, check out this course on Fully Automated MLOps.
A Makefile is a blueprint for building and managing software projects. It is a file containing instructions for automating tasks, streamlining complex build processes, and ensuring consistency.
To execute the commands within the Makefile, we use the make command-line tool. This tool can be run like a Python program by providing the arguments or just running it on its own.
A Makefile usually consists of a list of targets, dependencies, actions, and variables:
python test.py.python test.py $variable_1 $variable_2.In a nutshell, this is how the template of a MakeFile could look like:
Variable = some_value

Target: Dependencies
    Actions (commands to build the target) $Variable
Using our examples above, the MakeFile could look like this:
# Define variables
variable_1 = 5
variable_2 = 10

# Target to run a test with variables
test: test_data.txt # Dependency on test data file
python test.py $variable_1 $variable_2We can install the Make CLI tool on all operating systems.
For Linux, we need to use the following command in the terminal:
$ sudo apt install makeFor macOS, we can use homebrew to install make:
$ brew install makeWindows is a bit different. The Make tool can be used in multiple ways. The most popular options are WSL (Ubuntu Linxus), w64devkit, and GnuWin32.
Let’s download and install GnuWin32 from the SourceForge page.
To use it as a command-line tool in the terminal, we need to add the folder's location to the Windows environment variable. These are the steps we can take:
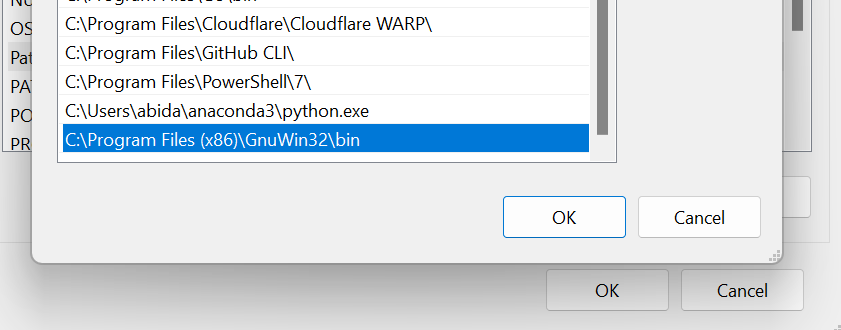
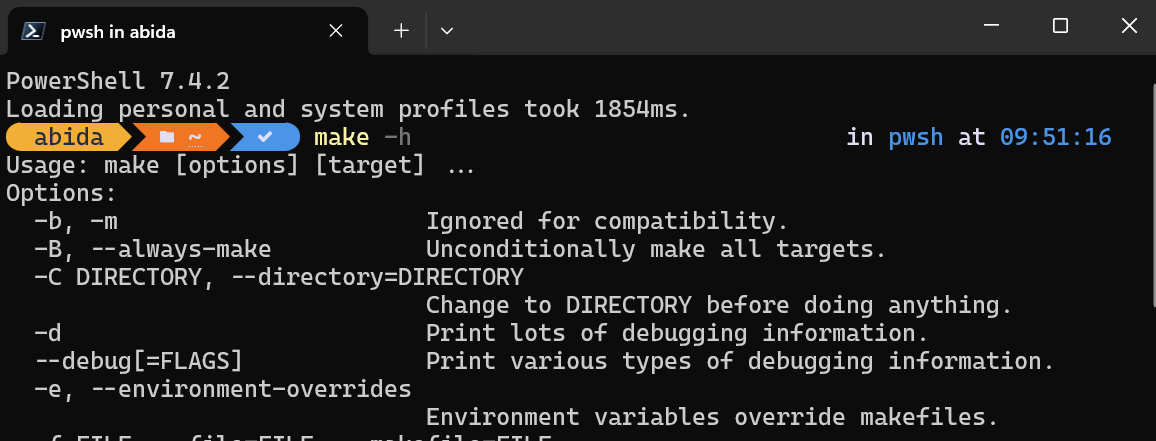
To test if Make is successfully installed, we can type make -h in the PowerShell.
In this section, we’ll learn how to use Makefile and Make CLI tools in a data science project.
We’ll use the World Happiness Report 2023 dataset to cover data processing, analysis, and saving data summaries and visualizations.
We start by going to the project directory and creating a folder called Makefile-Action. We then create the data_processing.py file within that folder and launch the VSCode editor.
$ cd GitHub
$ mkdir Makefile-Action
$ cd .\Makefile-Action\
$ code data_processing.pyWe begin with processing our data using Python. In the code block below, we take the following steps (note: this is an example code—in a real-world scenario, we’d probably have to perform more steps):
File: data_processing.py
import sys
import pandas as pd

# Check if the data location argument is provided
if len(sys.argv) != 2:
    print("Usage: python data_processing.py <data_location>")
    sys.exit(1)

# Load the raw dataset (step 1)
df = pd.read_csv(sys.argv[1])

# Rename columns to more descriptive names (step 2)
df.columns = [
    "Country",
    "Happiness Score",
    "Happiness Score Error",
    "Upper Whisker",
    "Lower Whisker",
    "GDP per Capita",
    "Social Support",
    "Healthy Life Expectancy",
    "Freedom to Make Life Choices",
    "Generosity",
    "Perceptions of Corruption",
    "Dystopia Happiness Score",
    "GDP per Capita",
    "Social Support",
    "Healthy Life Expectancy",
    "Freedom to Make Life Choices",
    "Generosity",
    "Perceptions of Corruption",
    "Dystopia Residual",
]

# Handle missing values by replacing them with the mean (step 3)
df.fillna(df.mean(numeric_only=True), inplace=True)

# Check for missing values after cleaning
print("Missing values after cleaning:")
print(df.isnull().sum())

print(df.head())

# Save the cleaned and normalized dataset to a new CSV file (step 4)
df.to_csv("processed_data\WHR2023_cleaned.csv", index=False)Now we continue with analyzing the data and save all our code into a file named data_analysis.py. We can create this file with the following terminal command:
$ code data_analysis.pyWe can also use the echo command to create the Python file and open it in a different code editor.
$ echo "" > data_analysis.pyIn the code block below, we:
File: data_analysis.py
import io
import sys

import matplotlib.pyplot as plt
import pandas as pd
import seaborn as sns

# Check if the data location argument is provided
if len(sys.argv) != 2:
    print("Usage: python data_analysis.py <data_location>")
    sys.exit(1)

# Load the clean dataset (step 1)
df = pd.read_csv(sys.argv[1])

# Data summary (step 2)
print("Data Summary:")
summary = df.describe()
data_head = df.head()
print(summary)
print(data_head)

# Collecting data information
buffer = io.StringIO()
df.info(buf=buffer)
info = buffer.getvalue()

## Write metrics to file
with open("processed_data/summary.txt", "w") as outfile:
    f"\n## Data Summary\n\n{summary}\n\n## Data Info\n\n{info}\n\n## Dataframe\n\n{data_head}"

print("Data summary saved in processed_data folder!")

# Distribution of Happiness Score (step 3)
plt.figure(figsize=(10, 6))
sns.displot(df["Happiness Score"])
plt.title("Distribution of Happiness Score")
plt.xlabel("Happiness Score")
plt.ylabel("Frequency")
plt.savefig("figures/happiness_score_distribution.png")

# Top 20 countries by Happiness Score
top_20_countries = df.nlargest(20, "Happiness Score")
plt.figure(figsize=(10, 6))
sns.barplot(x="Country", y="Happiness Score", data=top_20_countries)
plt.title("Top 20 Countries by Happiness Score")
plt.xlabel("Country")
plt.ylabel("Happiness Score")
plt.xticks(rotation=90)
plt.savefig("figures/top_20_countries_by_happiness_score.png")

# Scatter plot of Happiness Score vs GDP per Capita
plt.figure(figsize=(10, 6))
sns.scatterplot(x="GDP per Capita", y="Happiness Score", data=df)
plt.title("Happiness Score vs GDP per Capita")
plt.xlabel("GDP per Capita")
plt.ylabel("Happiness Score")
plt.savefig("figures/happiness_score_vs_gdp_per_capita.png")

# Visualize the relationship between Happiness Score and Social Support
plt.figure(figsize=(10, 6))
plt.scatter(x="Social Support", y="Happiness Score", data=df)
plt.xlabel("Social Support")
plt.ylabel("Happiness Score")
plt.title("Relationship between Social Support and Happiness Score")
plt.savefig("figures/social_support_happiness_relationship.png")

# Heatmap of correlations between variables
corr_matrix = df.drop("Country", axis=1).corr()
plt.figure(figsize=(12, 10))
sns.heatmap(corr_matrix, annot=True, cmap="coolwarm", square=True)
plt.title("Correlation Heatmap")
plt.savefig("figures/correlation_heatmap.png")
print("Visualizations saved to figures folder!")Before we create a Makefile, we need to set up a requirements.txt file to install all required Python packages on a new machine. This is how the requirements.txt file will look like:
pandas
numpy
seaborn
matplotlib
black
Our Makefile consists of variables, dependencies, targets, and actions—we’ll learn all the building blocks. We create a file named Makefile and start adding the actions for the targets:
File: Makefile
RAW_DATA_PATH = "raw_data/WHR2023.csv"
PROCESSED_DATA = "processed_data/WHR2023_cleaned.csv"

install:
    pip install --upgrade pip &&\
        pip install -r requirements.txt

format:
        black *.py --line-length 88

process: ./raw_data/WHR2023.csv
        python data_processing.py $(RAW_DATA_PATH)

analyze: ./processed_data/WHR2023_cleaned.csv
        python data_analysis.py $(PROCESSED_DATA)

clean:
        rm -f processed_data/* **/*.png

all: install format process analyze
To execute the target, we’ll use the make tool and provide the target name in the terminal.
$ make formatThe Black script ran successfully.
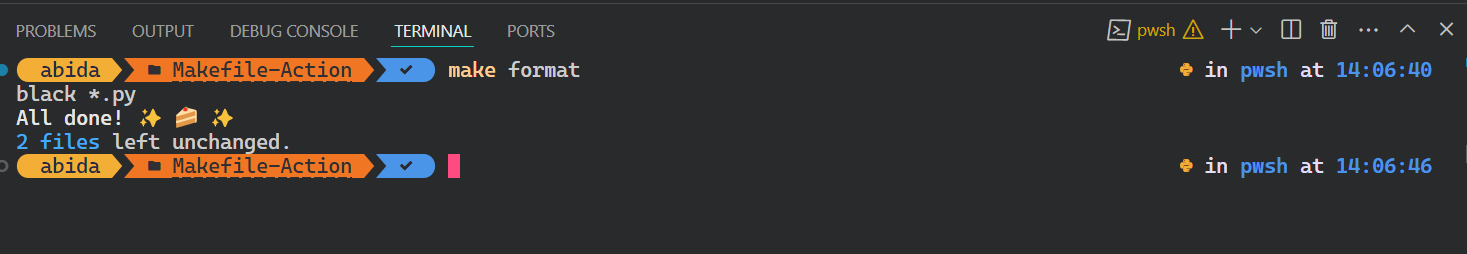
Let’s try to run the Python script for data processing.
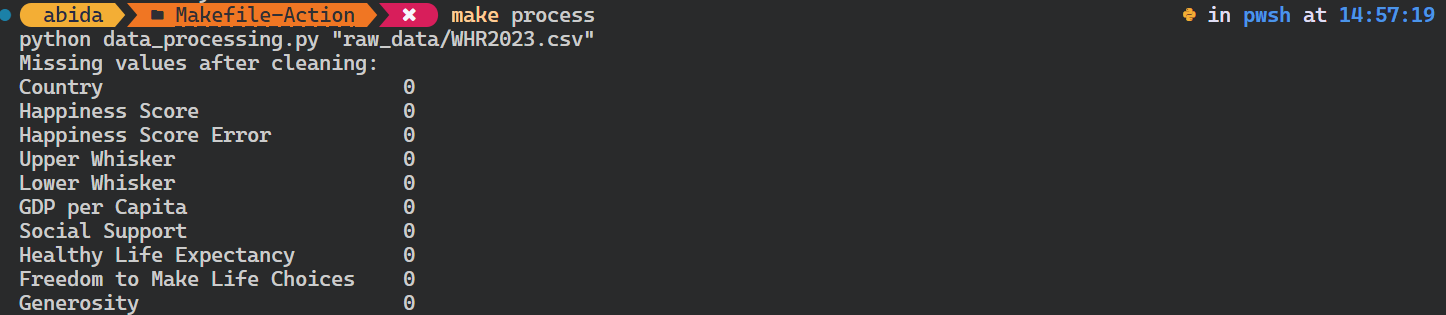
It’s important to note that it checks the target dependencies before running the process target. In our case, it checks whether the raw data file exists. If it doesn’t, the command won’t initiate.
$ make processAs we can see, it is that simple.
You can even override the existing variable by providing an additional argument to the make command.
In our case, we have changed the path of the raw data.
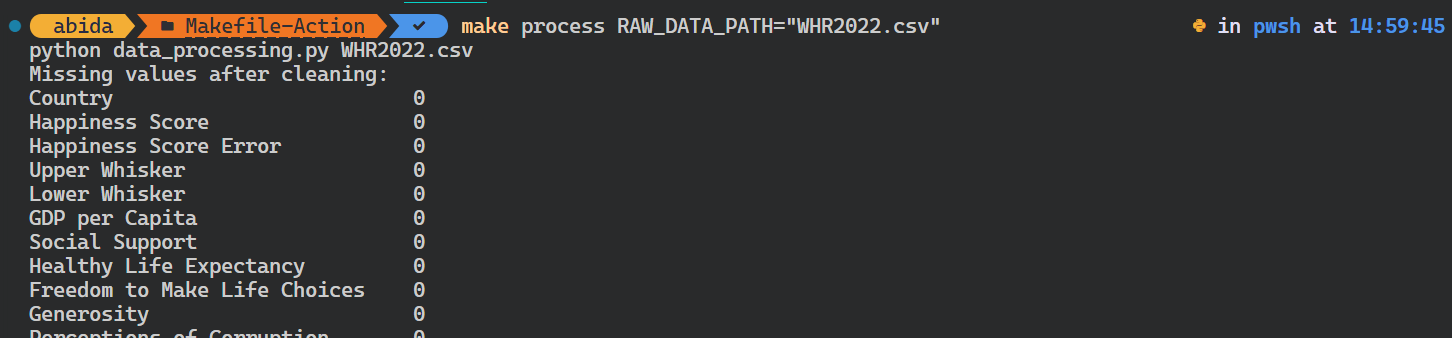
$ make process RAW_DATA_PATH="WHR2022.csv"The Python script ran with the different input argument.
To automate the entire workflow, we’ll use all as a target, which will learn, install, format, process, and analyze targets one by one.
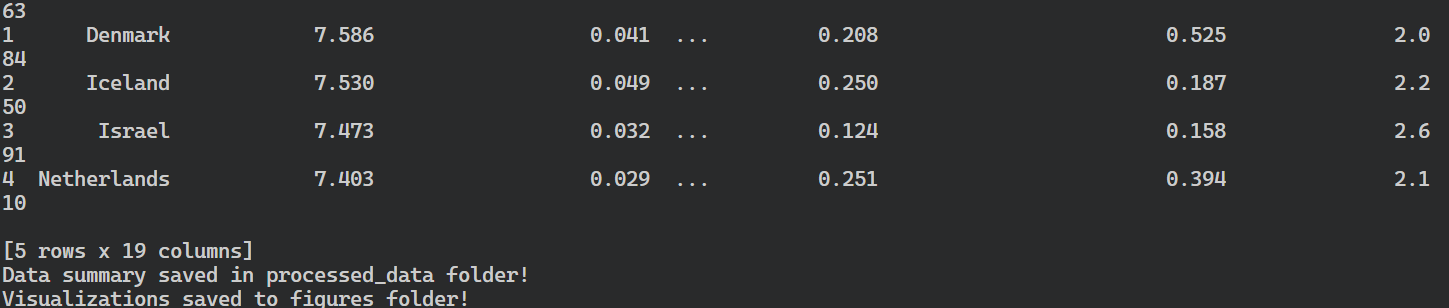
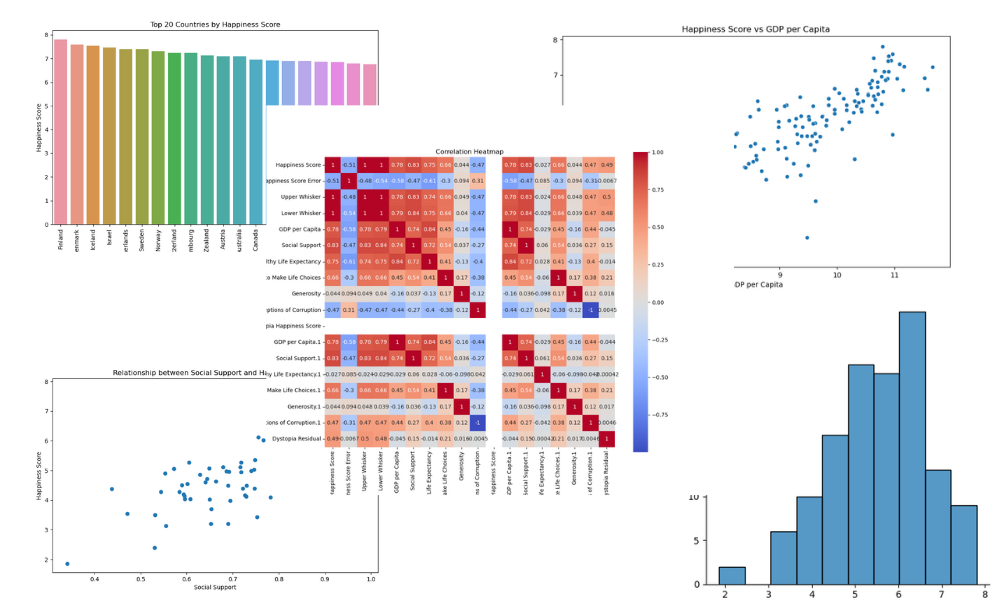
$ make allThe make command installed the Python packages, formatted the code, processed the data, and saved the summary and visualizations.
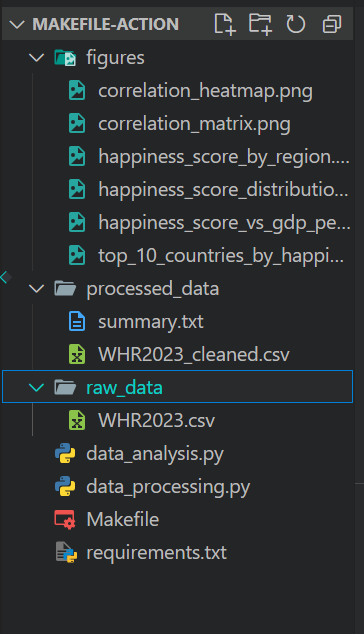
This is how your project directory should look like after running the make all command:
While Make excels at local automation within our development environment, GitHub Actions offers a cloud-based alternative.
GitHub Actions is generally used for CI/CD, which allows developers to compile, build, test, and deploy the application to production directly from GitHub.
For example, we can create a custom workflow that will be triggered based on specific events like push or pull requests. That workflow will run shell scripts and Python scripts, or we can even use pre-built actions. The custom workflow is a YML file, and it’s usually pretty straightforward to understand and start writing custom runs and actions.
Let’s explore the core components of GitHub Actions:
In this section, we’ll learn to use GitHub Actions and try to replicate the commands we previously used in the Makefile.
To transfer our code to GitHub, we have to convert our project folder to a Git repository using:
$ git initThen, we create a new repository in GitHub and copy the URL.
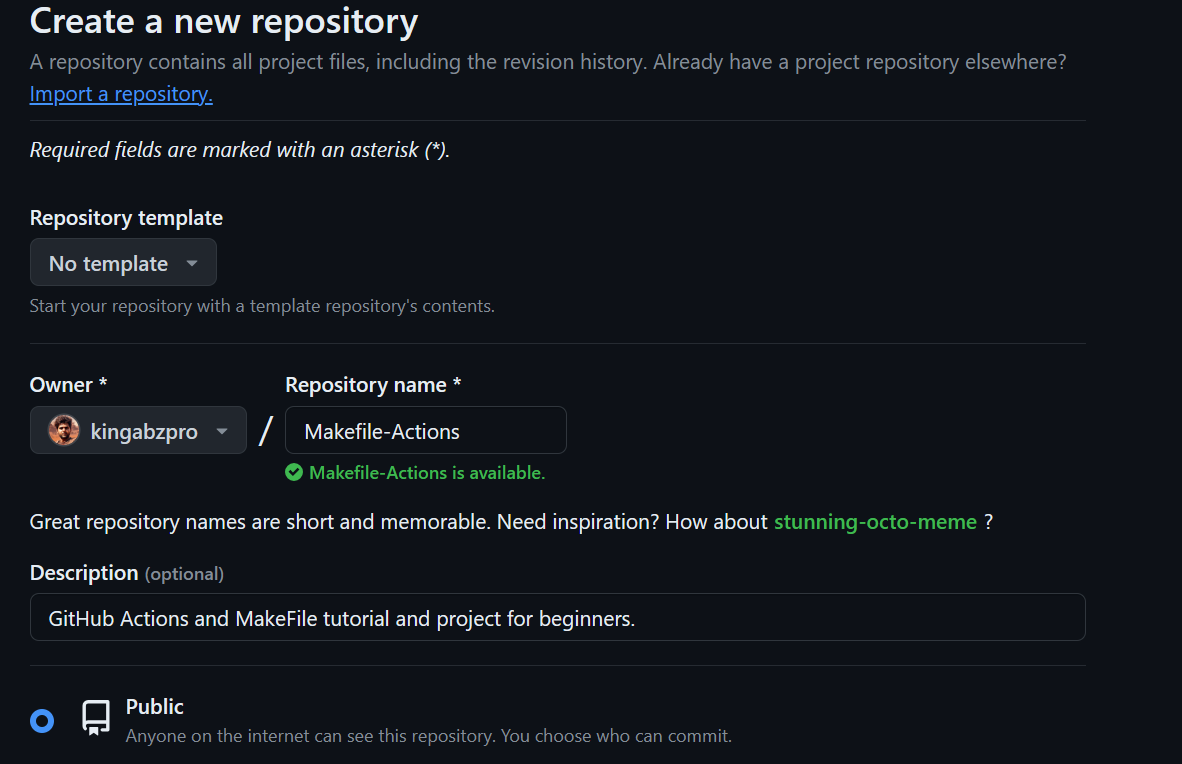
In the terminal, we type the commands below to:
master to the remote main branch.$ git remote add github https://github.com/kingabzpro/Makefile-Actions.git
$ git pull github main
$ git add .
$ git commit -m "adding all the files"
$ git push github master:mainAs a side note, if you need a brief recap on GitHub or Git, check out this beginner-friendly tutorial on GitHub and Git. It’ll help you version your data science project and share it with the team using the Git CLI tool.
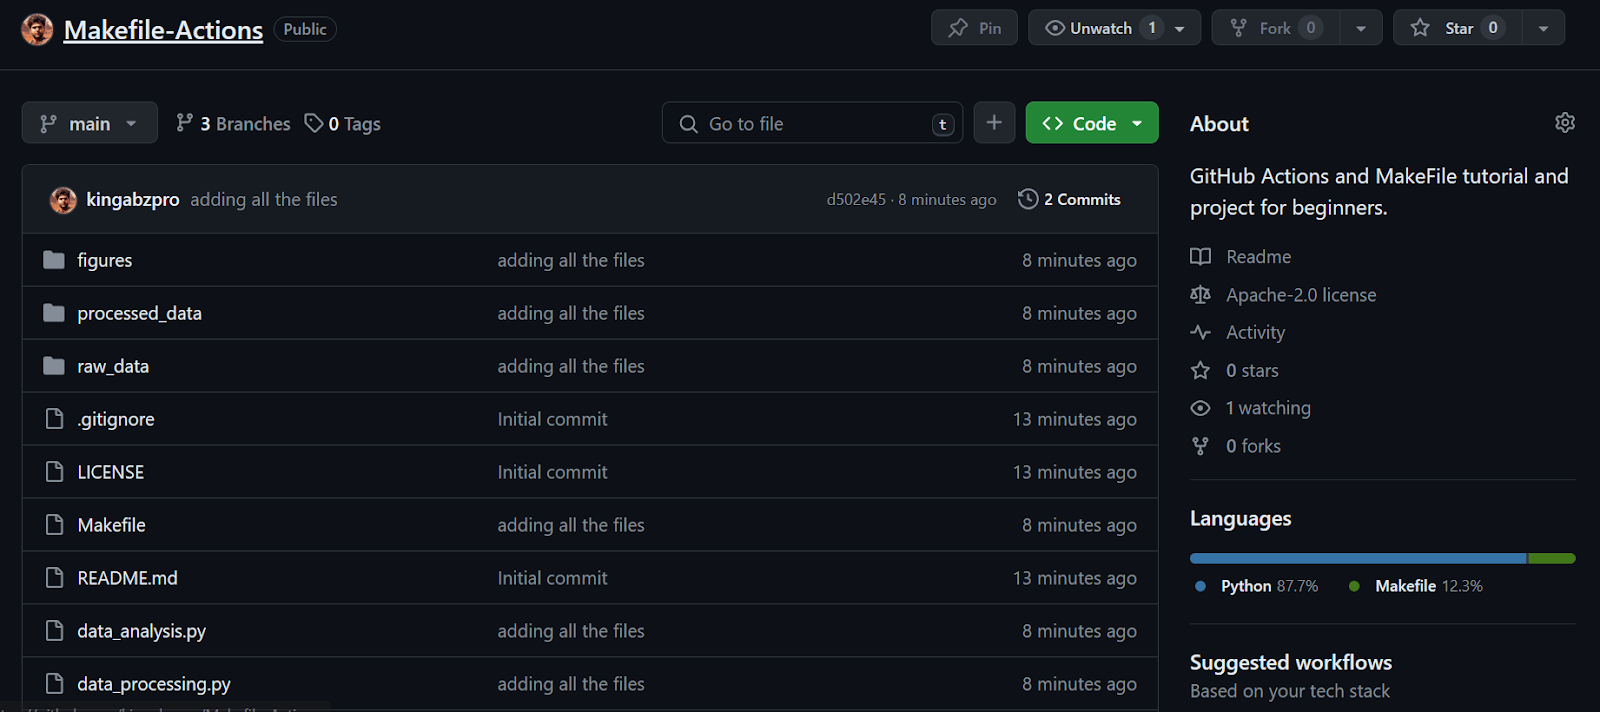
Continuing our lesson—we see that all the files have been successfully transferred to the remote repository.
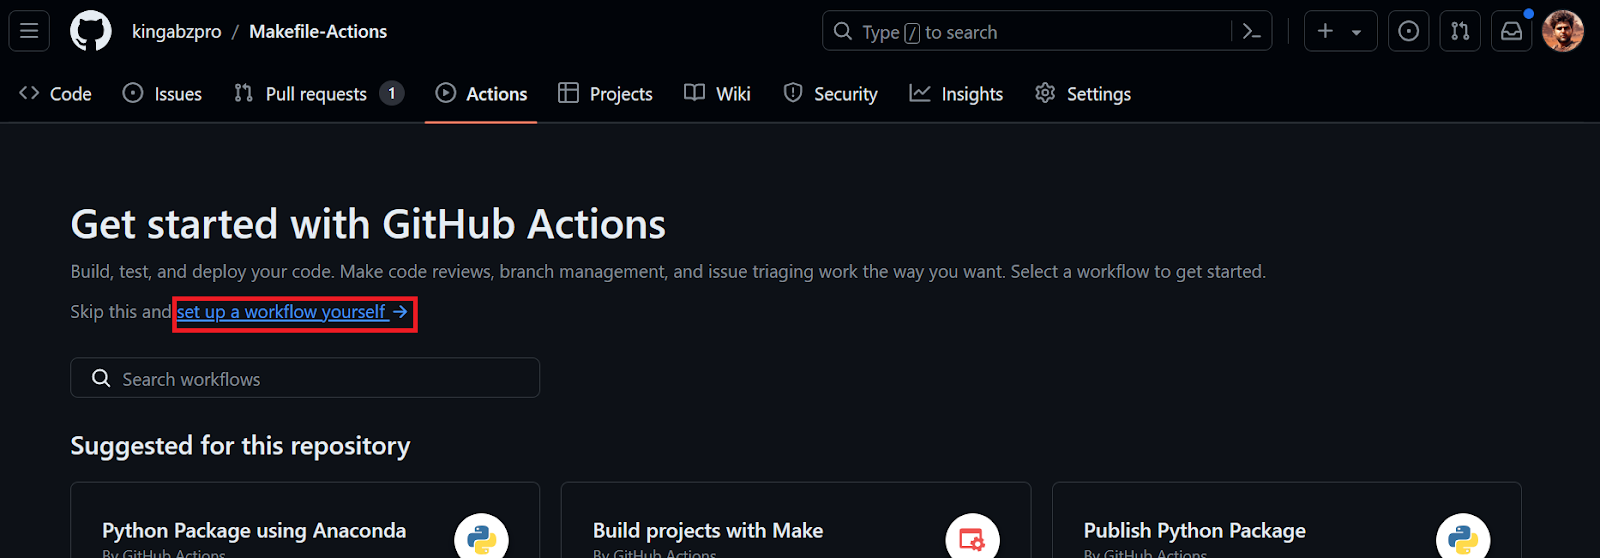
Next, we’ll create a GitHub Action workflow. We first need to go to the Actions tab on our repository kingabzpro/Makefile-Actions. Then, we click the blue text “set up a workflow yourself.”
We’ll be redirected to the YML file, where we’ll write all the code for setting up the environment and executing the commands. We will:
main branch or there is a pull request on the main branch.name: Data Processing and Analysis
on:
push:
branches: [ "main" ]
pull_request:
branches: [ "main" ]
jobs:
build:
runs-on: ubuntu-latest
steps:
- uses: actions/checkout@v3
- name: Install Packages
run: |
pip install --upgrade pip
pip install -r requirements.txt
- name: Format
run: black *.py --line-length 88
- name: Data Processing
env:
RAW_DATA_DIR: "./raw_data/WHR2023.csv"
run: python data_processing.py $RAW_DATA_DIR
- name: Data Analysis
env:
CLEAN_DATA_DIR: "./processed_data/WHR2023_cleaned.csv"
run: python data_analysis.py $CLEAN_DATA_DIRAfter committing the workflow file with the message, it’ll automatically start running the workflow.
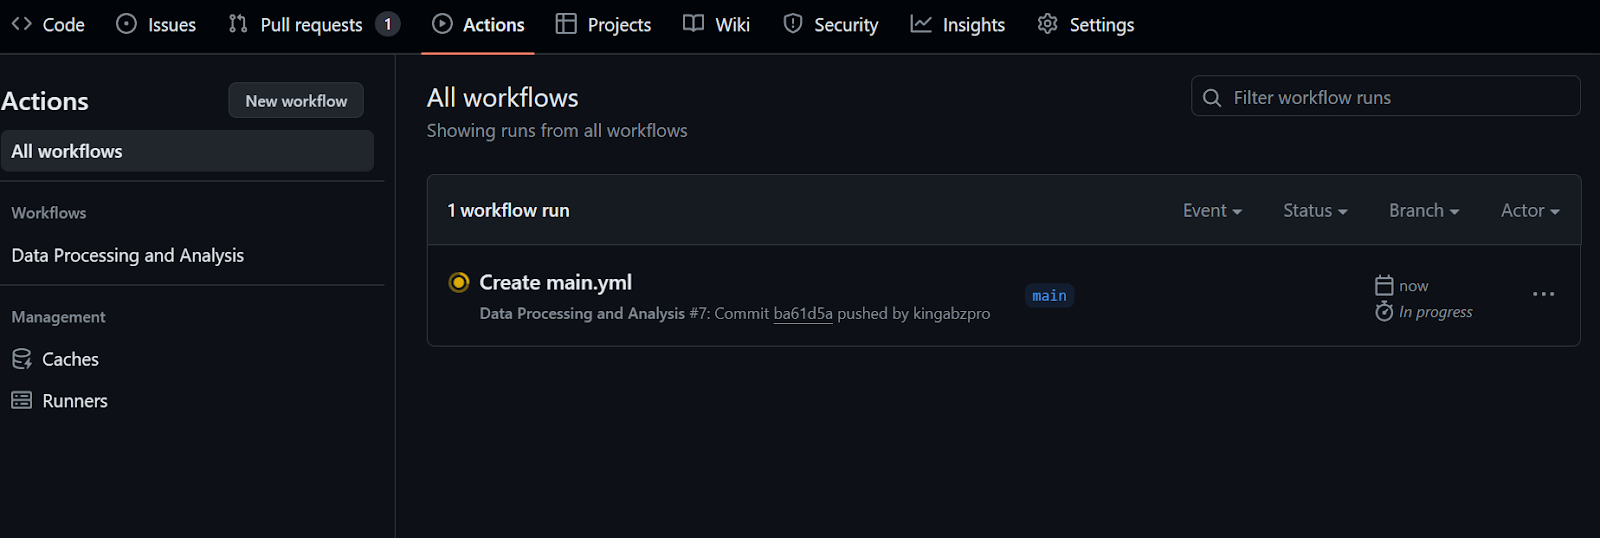
It will take at least 20 seconds to finish all the steps.
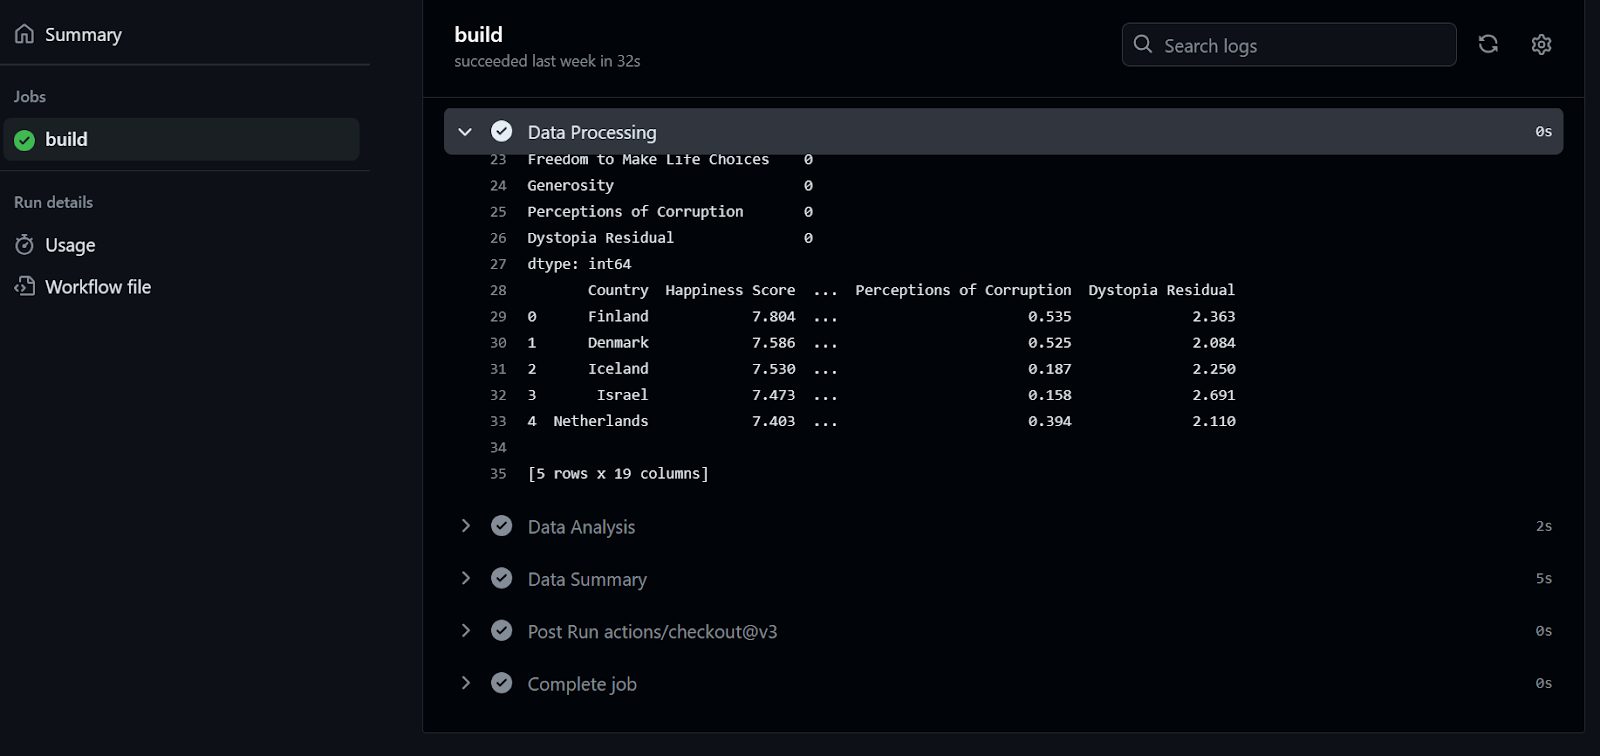
To check the logs, we first click on the workflow run, then the Build button, and then click on each job to access the logs.
If this was fun for you, you will surely enjoy this Beginner's Guide to CI/CD for Machine Learning, which covers the basics of building and automating a machine learning workflow.
To simplify and standardize the GitHub Action workflows, developers use Make commands within the workflow file. In this section, we’ll learn to simplify our workflow code using the Make command and learn to use the continuous machine learning (CML) action.
Before we start, we have to pull the workflow file from the remote repository.
$ git pullContinuous Machine Learning (CML) is an open-source library by iterative.ai that allows us to implement continuous integration within our data science project.
In this project, we’ll use the iterative/setup-cml GitHub Action that uses CML functions in the workflow to generate the analysis report using figures and data statistics.
The report will be created and attached to our GitHub commit for our team to review and approve before merging.
We’ll modify the Makefile and add another target “summary.” Note that:
cml tool to create a data analytical report and display it under the commit comments.Imagine adding so many lines to the GitHub workflow file—it’d be hard to read and modify. Instead, we’ll use make summary.
File: Makefile
summary: ./processed_data/summary.txt
echo "# Data Summary" > report.md
cat ./processed_data/summary.txt >> report.md
echo '\n# Data Analysis' >> report.md
echo '\n## Correlation Heatmap' >> report.md
echo '' >> report.md
echo '\n## Happiness Score Distribution' >> report.md
echo '' >> report.md
echo '\n## Happiness Score vs GDP per Capita' >> report.md
echo '' >> report.md
echo '\n## Social Support vs Happiness Relationship' >> report.md
echo '' >> report.md
echo '\n## Top 20 Countries by Happiness Score' >> report.md
echo '' >> report.md
cml comment create report.md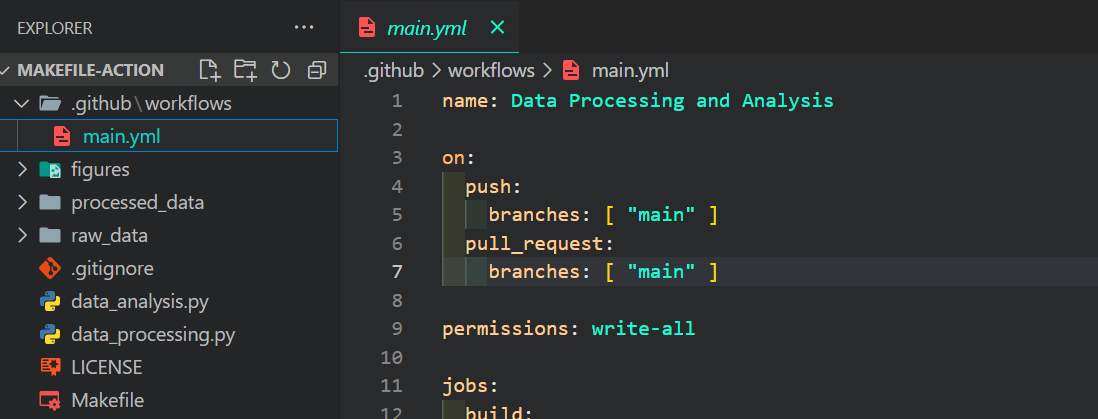
We will now edit our main.yml file, which we can find in the .github/workflows directory.
We change all the commands and Python scripts with the make command and provide permission for the CML Action to create the data report in the commit comment. Additionally, let’s make sure we don’t forget to add the iterative/setup-cml@v3 Action to our run.
name: Data Processing and Analysis

on:
  push:
    branches: [ "main" ]
  pull_request:
    branches: [ "main" ]

permissions: write-all

jobs:
  build:
    runs-on: ubuntu-latest
    steps:
      - uses: actions/checkout@v3
      - uses: iterative/setup-cml@v3
      - name: Install Packages
        run: make install
      - name: Format
        run: make format
      - name: Data Processing
        env:
          RAW_DATA_DIR: "./raw_data/WHR2023.csv"
        run: make process RAW_DATA_PATH=$RAW_DATA_DIR
      - name: Data Analysis
        env:
          CLEAN_DATA_DIR: "./processed_data/WHR2023_cleaned.csv"
        run: make analyze PROCESSED_DATA=$CLEAN_DATA_DIR
      - name: Data Summary
        env:
          REPO_TOKEN: ${{ secrets.GITHUB_TOKEN }}
run: make summaryTo execute the workflow, we only need to commit all the changes and sync them with the remote main branch.
$ git commit -am "makefile and github action combo"
$ git push github master:main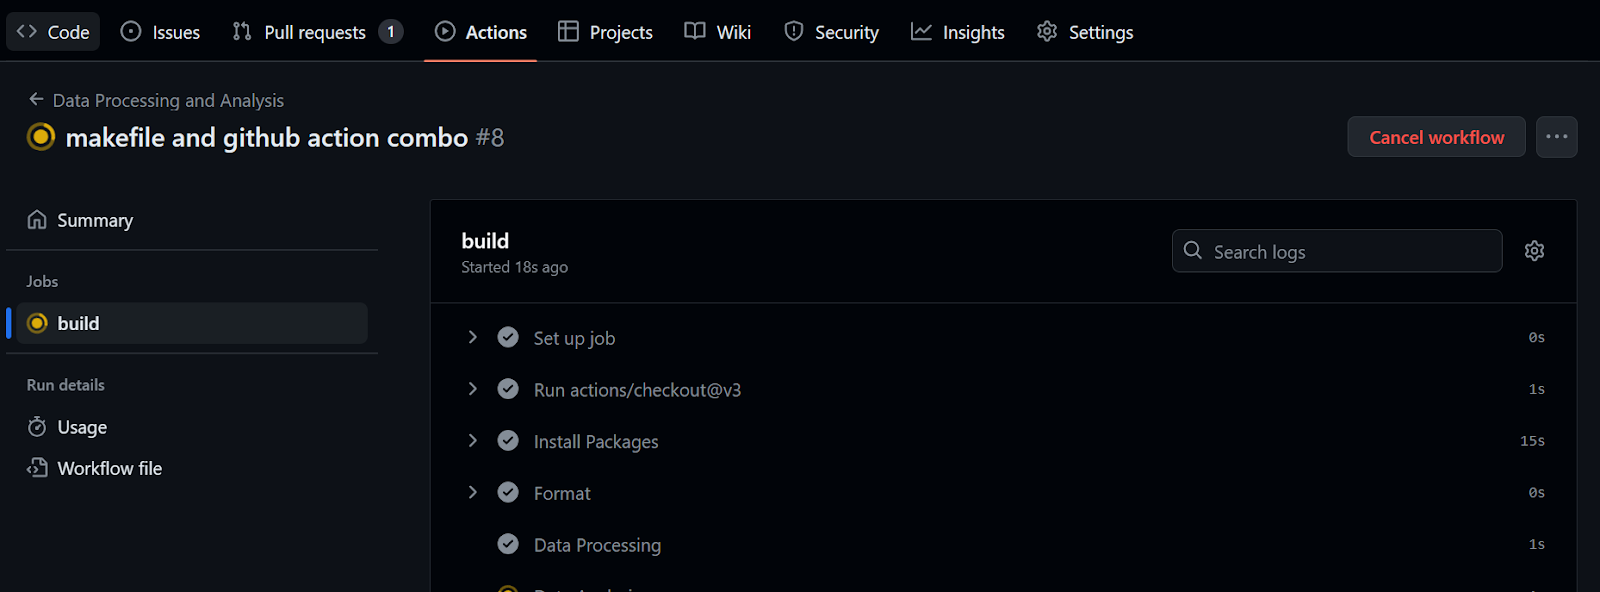
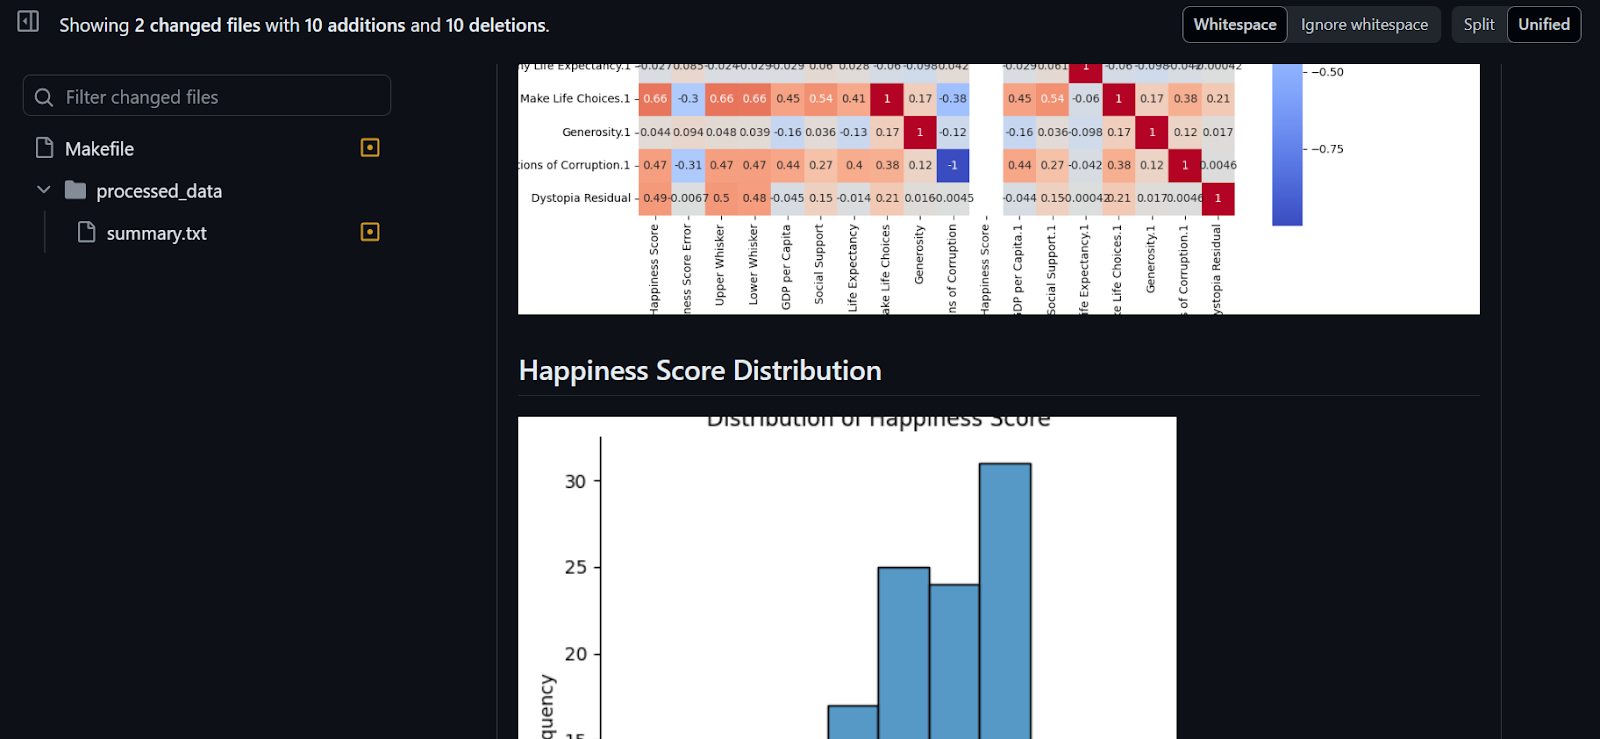
It took 32 seconds to run the workflow—our report is ready to be reviewed. To do that, we go to the build summary, scroll down to click on the Data Summary tab, and then click on the comment link (the link you see on line 20 in the figure below):
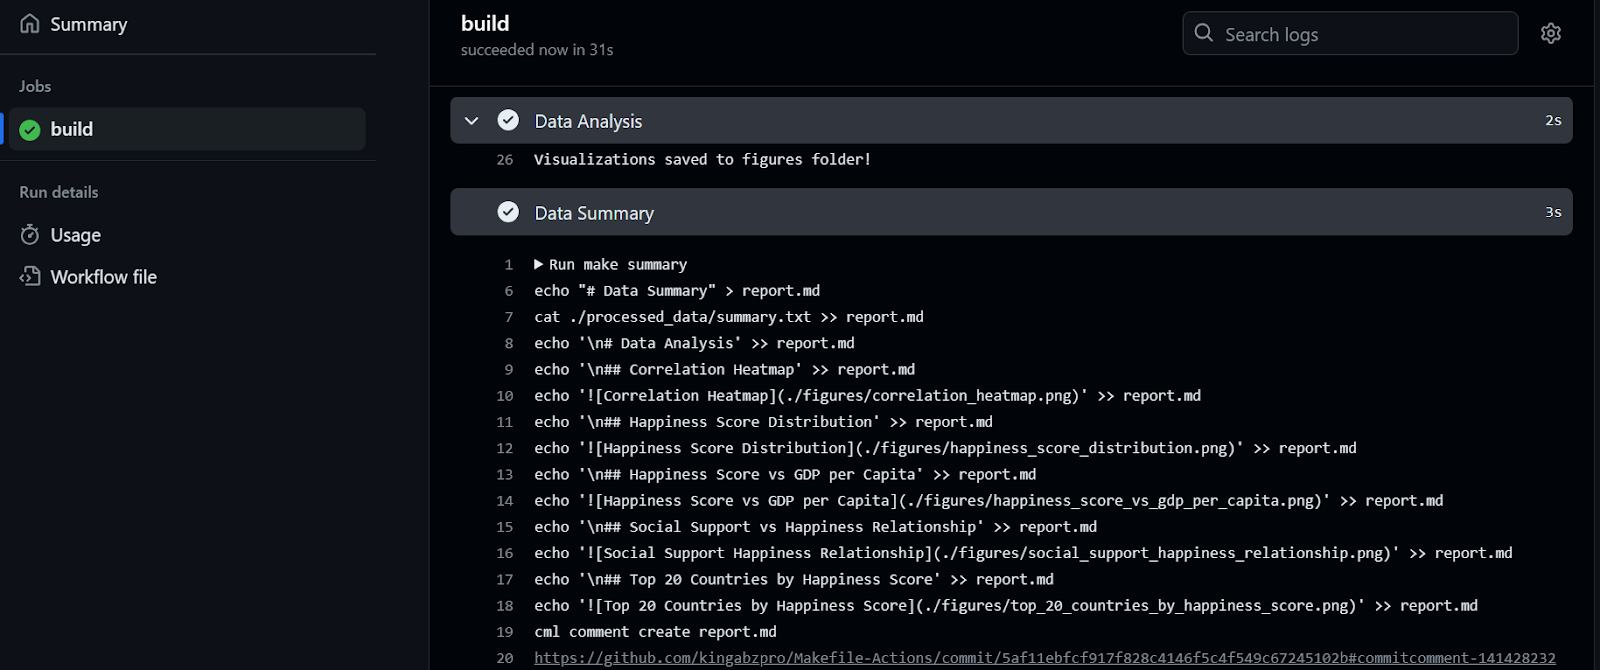
As we can see, the data summary and data visualizations are attached to our commit.
The project is available on kingabzpro/Makefile-Actions, and you can use it as a guide when you get stuck. The repository is public, so just fork it and experience the magic yourself!
In this tutorial, we focused on Makefile and GitHub Actions for automating the generation of data analytical reports.
We also learned how to build and run the workflow and use the Make tool within the GitHub workflow to optimize and simplify the automation process. Instead of writing multiple lines of code, we can use make summary to generate a data analysis report that will be attached to our commit.
If you want to master the art of CI/CD for data science, try out this course on CI/CD for Machine Learning. It covers the fundamentals of CI/CD, GitHub Actions, data versioning, and automating model hyperparameter optimization and evaluation.
Become a machine learning engineer!
Track
Track
Course
blog
Srujana Maddula
9 min
blog
Jake Roach
13 min
podcast
Richie Cotton
39 min
tutorial
Zoumana Keita
tutorial
Tim Lu
8 min
tutorial
Jake Roach
15 min